When I took on the project manager role for FutureMakers Coalition’s Data & Reporting Team, one of my personal goals was to learn about the various sources of education and workforce development data that the Coalition’s Action Teams use to guide their efforts. The upcoming annual Education and Workforce Outcomes Report relies heavily on federal and state databases and presents data at the regional and county levels for the five counties in southwest Florida. Past newsletter articles have explored other data sources that allowed us to drill down further to specific county zip codes. This article continues the exploration of data sources at the school level.
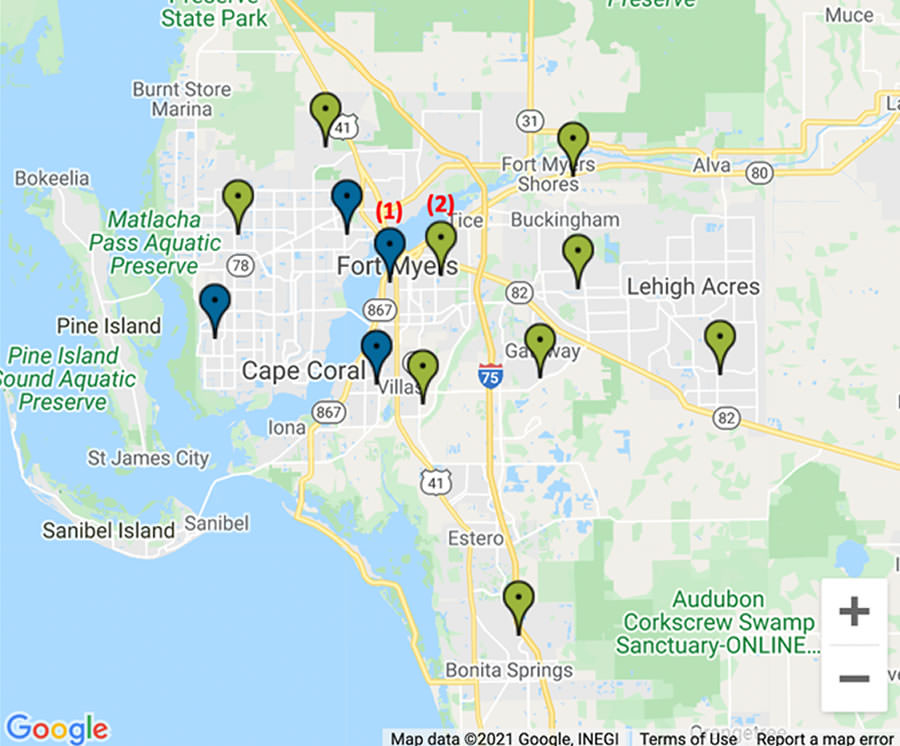
Fort Myers High School and Dunbar High School are 3.5 miles apart in Fort Myers, FL (Lee County).
Both high schools are magnet schools with International Baccalaureate programs that also offer career/technical tracks for their students. The schools are similar in student body size – 1,944 and 1,979 – with similar student to teacher ratios – 19.8 and 19.6 students per teacher – for Fort Myers High School and Dunbar High School, respectively (2018-19). But the similarities between the two schools seem to end there.
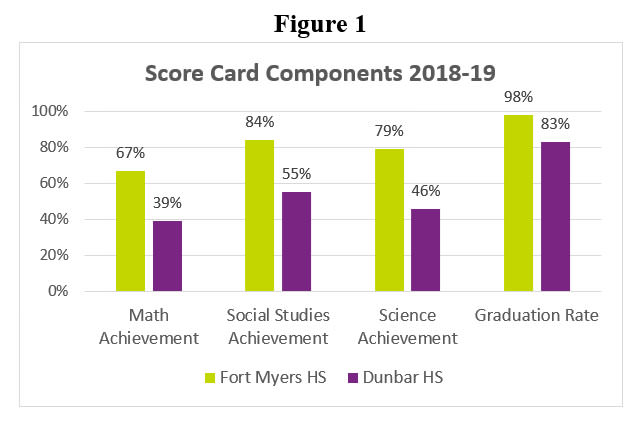
For the 2018-19 school year, Fort Myers Hight School received an “A” school report card grade compared to Dunbar High School’s “C” grade. Figure 1 illustrates several of the report card components for the two schools that contributed to their overall report card grades (https://edudata.fldoe.org). Fort Myers High School outperforms Dunbar High School in each of the components presented here.
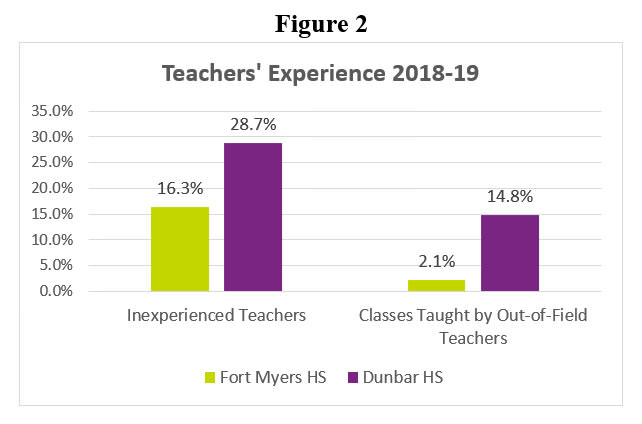
One interesting parameter that may help to explain the differences in the report card components is the relative experience of the teachers in the two schools. As noted above, the student to teacher ratios between the two schools are similar, but the percent of inexperienced teachers and the percent of classes taught by out-of-field teachers are much greater at Dunbar High School compared to Fort Myers High School (see Figure 2).
Although the schools are only 3.5 miles apart geographically, the economic differences between the zip codes in which the schools are located may also provide clues. Fort Myers High School falls in zip code 33901, which reports an under-18 poverty rate of 28.5%. Zip code 33916, where Dunbar High School is located, reports an under-18 poverty rate of 39.9% (www.flchamber.com/floridagapmap). Of note, Dunbar High School qualifies for the federal Title 1 program, which provides local educational agencies with resources to help children from low-income families gain a high-quality education and to attain the necessary skills to master the Florida Standards. Finally, economic disparities between two geographical areas often correlate well with the distribution of race/ethnicity in the two populations. For example, Fort Myers High School’s student population is 50.7% white, while 11.2% of Dunbar High School’s students is white (2018-19; https://edudata.fldoe.org).
Examining education outcomes data on a school-by-school level may help FutureMakers Coalition’s network plan where to focus limited resources and how to better engage with the schools in most need. Furthermore, issues may become more conspicuous, leading to better defined actions to remove systemic barriers for students and to improve education opportunities. Creating a more equitable future for all will go a long way toward achieving the Coalition’s goal of 55% of working age adults that hold post-high school credentials to by 2025.
By Neal Mantick, FutureMaker