In March’s newsletter, we explored how data from multiple sources (like the many pieces of a large jigsaw puzzle) are often needed to fully describe and understand a complicated system or policy issue. For example, we took the Third Grade Reading Proficiency outcome that was reported for each SW Florida county, as well as by race and by gender in the 2019 Educational and Workforce Outcomes Report and drilled down into the Lee County data by zip code. The March newsletter reported that Lee County’s Third Grade Reading Proficiency outcome (percent scoring 3 or above) ranged from a high of 91% in zip code 33957 to a low of 31% in zip code 33905. We also noted that the percent of children (under 18 years old) living in poverty also varied between those two zip codes – 8.9% in zip code 33957 vs. 18.1% in zip code 33905. We do not have enough information to confirm a direct correlation among zip code, child poverty level, and Third Grade Reading Proficiency, but they are more pieces of the puzzle to evaluate.
As the FutureMakers Coalition prepares for this year’s annual report, we will continue to try and identify more puzzle pieces to help us better understand the educational outcomes of interest. We already know all too well, however, that the COVID pandemic caused widespread disruption to school routines, requiring educators, parents, and students to adapt to on-line classes at home. We also learned that COVID prevented some educational data like the 2020 Third Grade Reading Proficiency outcome from being collected. Pursuant to Florida Department of Education Emergency Order No. 2020-EO-1, spring K-12 statewide assessment test administrations for the 2019-2020 school year were canceled.
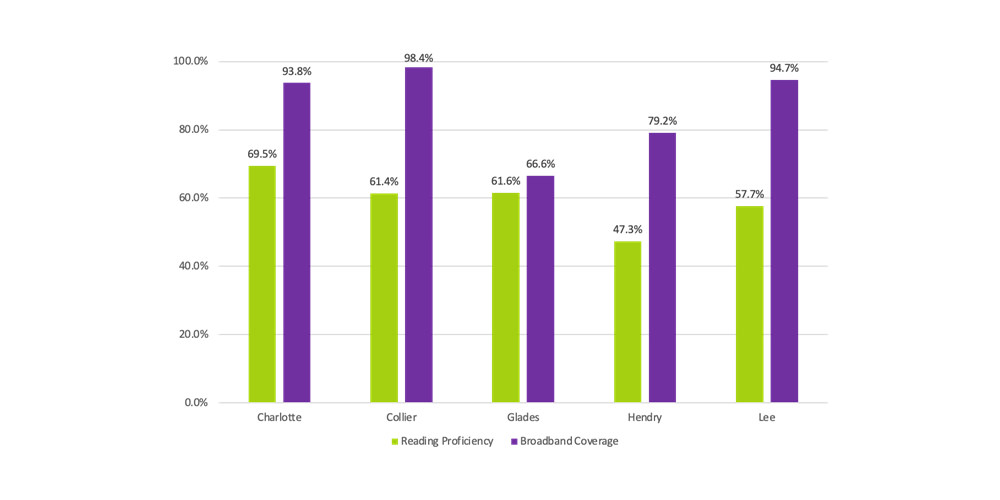
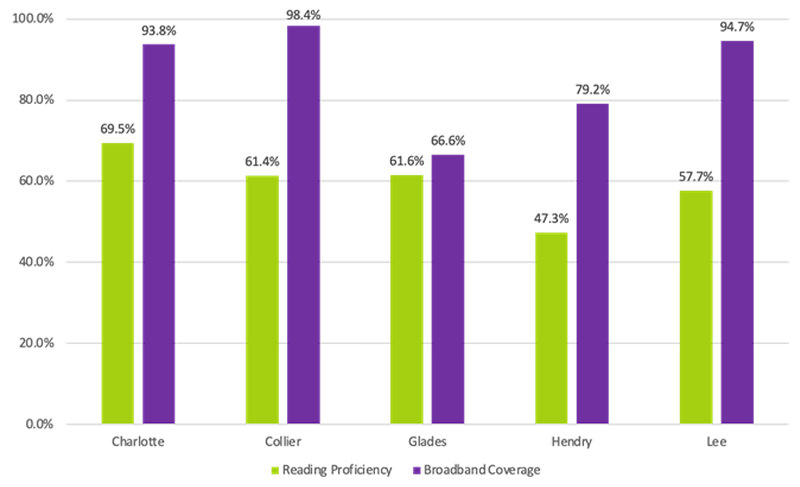
How can the FutureMakers Coalition accurately evaluate our efforts when pieces of the puzzle are missing? Are we able to predict the effects of the disruptions in the 2019-2020 and 2020-2021 school years caused by COVID in order to proactively prioritize and implement corrective actions? With the reliance on on-line learning, students’ access to the internet became a major focus of concern. Sticking with the Third Grade Reading Proficiency outcome as an example, Figure 1 displays the 2019 reading proficiency outcome (the percent of students achieving a 3 or above) by SW Florida county along with the percent broadband coverage for that county (https://broadbandnow.com/Florida).
Figure 1
Third Grade Reading Proficiency 2018-2019 (Percent Scoring 3 or Above) and Percent Broadband Coverage (February 2021) in the SW Florida Counties

None of the SW Florida counties achieved the 85% target in Third Grade Reading Proficiency in 2019 prior to COVID – the highest score was 69.5% in Charlotte County – so we were already facing a daunting challenge. Considering that the coastal counties of Charlotte, Collier, and Lee all have greater than 90% broadband coverage, will the students in these counties be able to (at least) maintain their 2019 reading proficiency levels post-COVID when the statewide assessment tests are presumably reinstated this year? Will the students in Glades and Hendry counties, with 66.6% and 79.2% broadband coverage respectively, be able to maintain their 2019 levels or should we expect a decline in the student’s reading proficiency? Are there proactive corrective actions that can be implemented across the SW Florida counties to minimize any decline in reading proficiency? As the Data & Reporting Team assembles this year’s Educational and Workforce Outcomes Report, we will be reaching out to the Coalition’s network, many of whom ARE the educators, parents, and students who found the resilience to meet the daily COVID challenges, to add their stories and to provide context around the educational outcome statistics.


