Using data to solve a complex social problem is like assembling a huge jigsaw puzzle. No single puzzle piece alone holds enough clues that can help us define the optimal solution(s). In addition, there are multiple strategies to assembling a jigsaw puzzle. For example, one may like to find and assemble the outside border pieces first then fill in the remaining interior pieces -OR- one may prefer to group like colors and images first then build out to the border. All strategies have their merits and a combination of strategies often yields the best solutions.
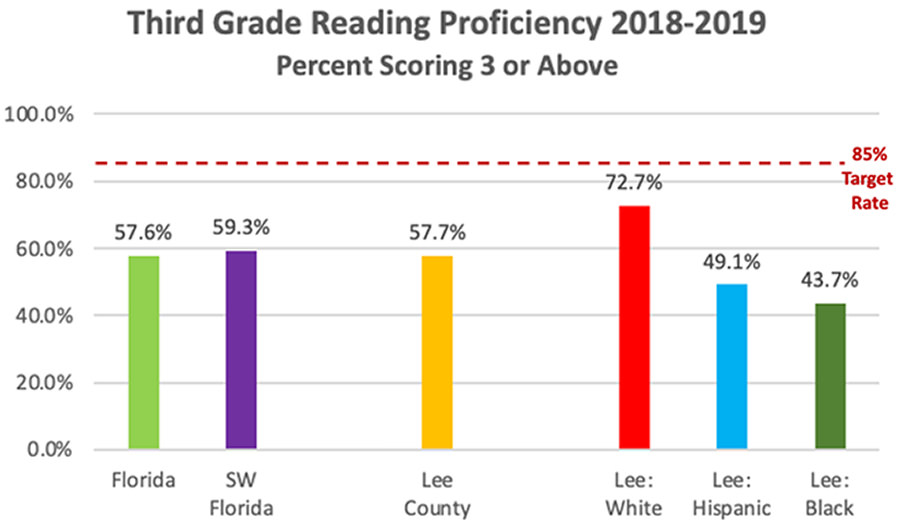
To help illustrate this concept, we can use the Third Grade Reading Proficiency data from the 2019 Southwest Florida Education and Workforce Outcomes Report (https://www.futuremakerscoalition.com/wp-content/uploads/2020/07/2019-Outcomes-Report_v1.0FINAL-MCI.pdf). The chart below provides an increasing number of puzzle pieces as the data is presented from left to right.
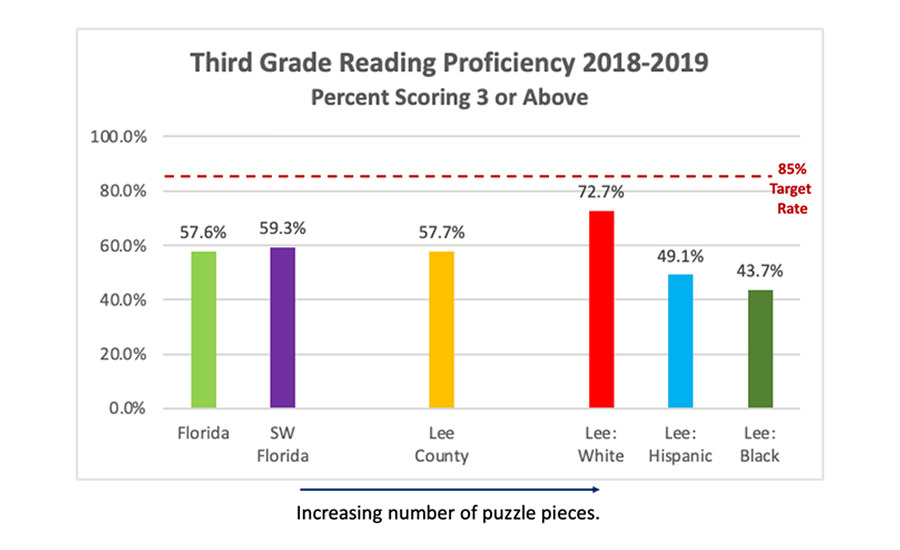
The Third Grade Reading Proficiency data for Florida and SW Florida may be considered the “outside border” of the jigsaw puzzle, while the county-specific data (Lee County) and county data by race provide more detailed information. The outside border alone does not provide enough clues as to why the state and region are not meeting the 85% reading proficiency target, whereas the county data by race may begin to suggest potential areas of focus and corrective actions.
The Third Grade Reading Proficiency data can be broken down to even smaller puzzle pieces within the county – for example, by zip code. The illustration below provides the percent of students scoring a Third Grade Reading Proficiency score of 3 or above by school within the Lee County zip codes (https://www.flchamber.com/floridagapmap/).
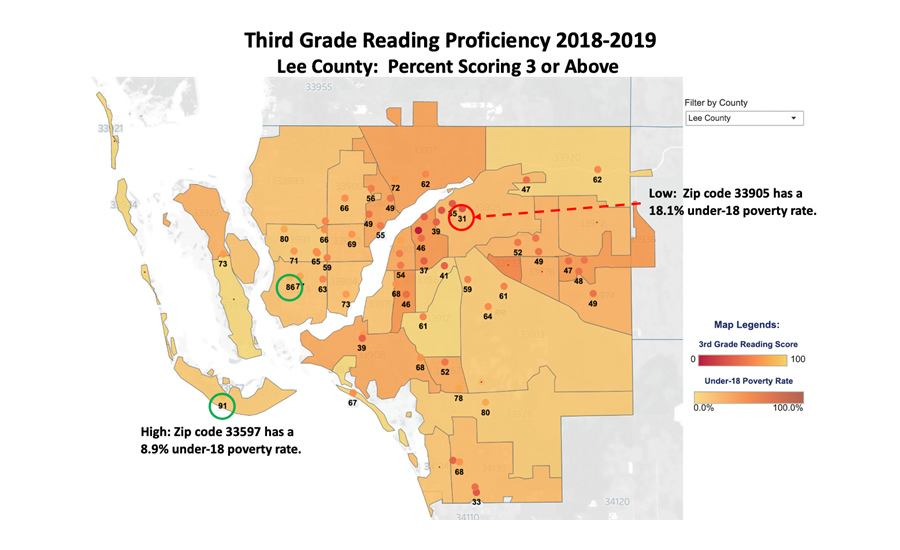
Each dot on the map represents a school in Lee County. As the dots become darker in orange color, a lower percent of students achieved a Third Grade Reading Proficiency score of 3 or above in 2018-2019. These data indicate that only two schools in Lee County met or exceeded the 85% target rate: The Sanibel School (91%) and Oasis Charter Elementary School (86%). Manatee Elementary School had the lowest percent (31%) of students who achieved a Third Grade Reading Proficiency score of 3 or above. In addition to the Third Grade Reading Proficiency rates, the Lee County data above also present the under-18 poverty rates for each zip code. As the zip code areas become darker in orange shading, the under-18 poverty rate increases, which may also prove to be important pieces of the entire puzzle.
Interestingly, more detailed data often lead to more questions to explore. For example, is there a correlation between the student demographics within a zip code and the under-18 poverty rate? Does any correlation influence the Third Grade Reading Proficiency rates within a specific zip code or school? As noted above, in order to define the optimal solution(s) to a complex puzzle, it is often most beneficial to employ multiple strategies (and our imaginations!) to identify and assemble the critical puzzle pieces. We will explore selected zip code and related census data for the upcoming 2020 Southwest Florida Education and Workforce Outcomes Report in an effort to give the extensive FutureMakers Coalition network the data it needs to achieve our 55% goal.